Visual + inertial
A clearer inspection record.
Motion signals gain meaning when reviewers can compare them with the camera view from the same corridor context.
Solutions
All Solutions Overview RailEyes RailEdge Camera RailEyes TrackViewReal-Time Railway StreamRailEyes ZoningRailEyes Vegetation DetectionRailEyes Map/Track/Lane MatchingRailEyes AnonymizationRailEyes DynamicsRailEyes MapmatchingRailEyes HeatmapsConsultingSoftware and Data Solution
RailEyes Dynamics blends onboard inertial signals, visual corridor proof, and rail-specific map matching so abnormal motion patterns can be reviewed at the correct track location.
Documented basis
The hardware report states that onboard IMU data collection was validated for detecting train motion during the pilot, creating a foundation for route-linked motion review.
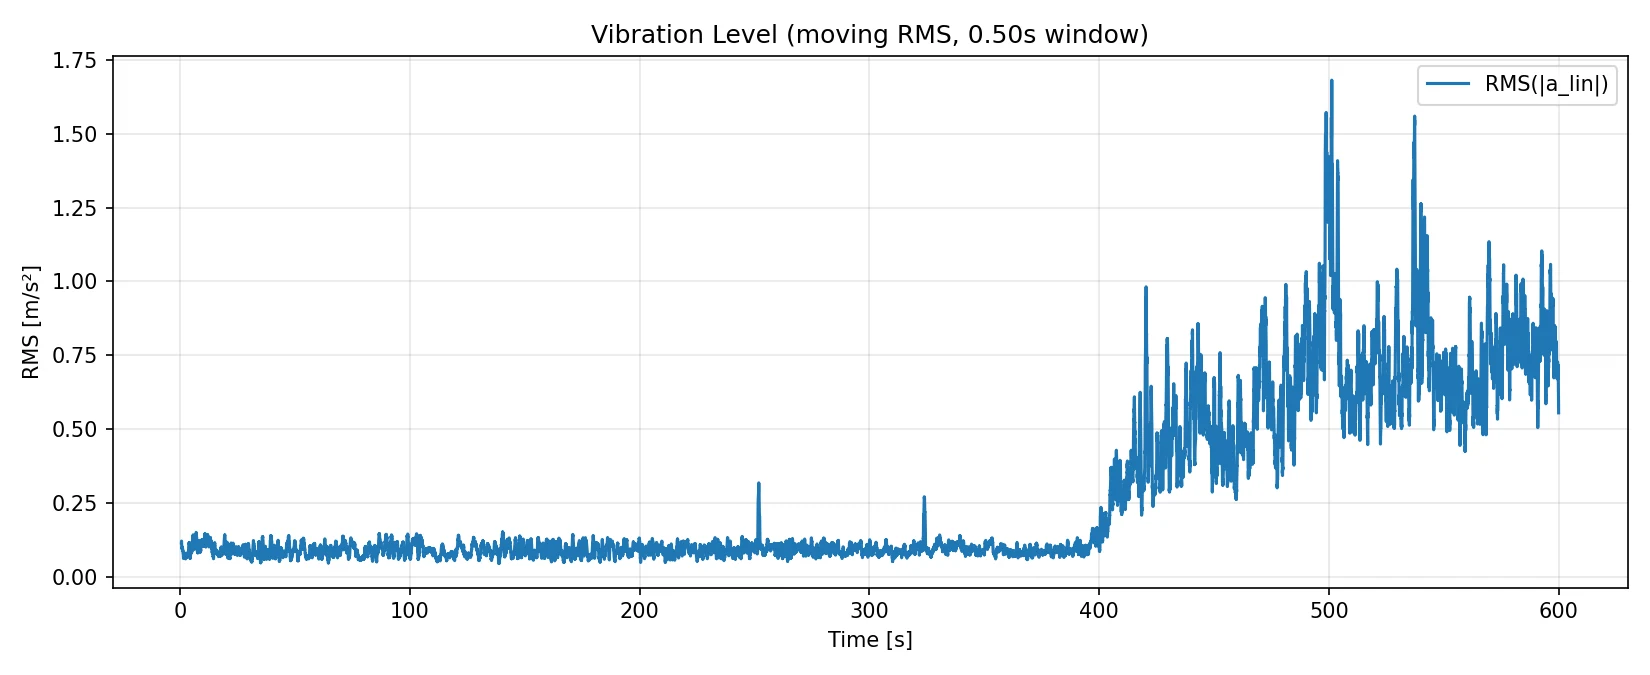
Route dynamics timeline
Yellow and red segments indicate stronger vibration or abnormal motion windows.
Infrastructure-quality signals
Journey quality metrics are useful, but RailEyes Dynamics is designed to add infrastructure context. When elevated or red abnormal motion records appear at a map-matched track location, they become review signals that can be checked beside visual corridor evidence.
These signals are not automatic fault diagnoses. They help operators flag repeated inconsistencies, identify locations that deserve closer inspection, and investigate conditions that may be difficult to understand from a single image, journey, or field visit.
Over repeated passes, the same PK or track segment can accumulate sensory context across time, temperature, speed, season, and maintenance state. That history can support predictive-maintenance workflows by showing where motion patterns are stable, worsening, or linked to specific operating conditions.
Visual + inertial
Motion signals gain meaning when reviewers can compare them with the camera view from the same corridor context.
Map-matched
Rail-specific matching helps teams review abnormal records against the correct track segment, station area, or PK reference.
Repeated passes
Repeated observations at the same location can reveal whether a motion pattern is isolated, recurring, or changing over time.
Operator value
Infrastructure teams can review motion signals beside visual observations and rail location context, helping them distinguish isolated journey events from repeated infrastructure-quality signals.
Investor value
Repeated measurements at the same map-matched location can compound into a defensible railway dataset for trend analysis, predictive-maintenance enablement, and future analytical products.
Workflow
Outputs
Supporting technical context
The vibration view supports the same story at a more technical level: motion readings can be examined as route-linked records rather than detached journey statistics.
Connected products
Dynamics becomes more useful when motion signals can be compared with corridor imagery and captured repeatedly through the same edge hardware foundation.